
BOJ accounts and a firm dollar test Japan’s normalisation
The durability of Japan’s policy shift will show up in consumption data, balance-sheet publications and the cost of dollar funding.
 Odile MarchettiCentral banks, rates and sovereign debt

A release attributed to the Bank of Japan says accounts dated 30 September were published, while the bank’s materials refer to a Consumption Activity Index. Around those markers, US yields remain elevated, with the 10-year at 5.22% and the two-year at 4.75% on 8 October, while the dollar index was 121.3848 on 2 October. The combination matters for yen carry trades and JGB volatility.
On 8 October, the US 10-year Treasury yield stood at 5.22%, and the two-year stood at 4.75%. That leaves 47 basis points of curve steepness, a wide enough gap to keep dollar fixed-income carry alive for investors comparing short-dated funding with longer-dated exposure.
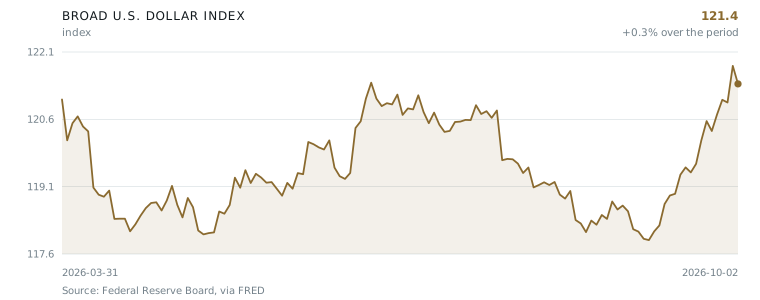
The dollar side of the global carry trade has another marker. On 2 October, the trade-weighted dollar index was 121.3848, above the round 120 level. A firm dollar can reinforce the return from holding dollar assets when the position is funded in a lower-yielding currency, and it can also raise the local-currency value of yen-funded dollar exposure until the hedge or funding leg is paid.
Overnight dollar funding costs were close together on 9 October. The effective federal funds rate was 3.88%, while SOFR was 3.87%. One basis point separates the two, suggesting money-market conditions were not showing stress in those readings. The VIX was 15.21 on 12 October, a level in the mid-teens that often coincides with demand for yield rather than demand for protection.
BOJ publications carry the domestic burden
The Japanese side of the story rests on two publication references. The Bank of Japan publishes a Consumption Activity Index, according to the bank’s materials. One side treats that as enough to use the index as a gauge of household spending; the other side wants the primary BOJ release before putting weight on it.
The next test will be whether domestic spending and balance-sheet signals align with a policy path that can survive a dollar index above 121 and a US 10-year above 5%.
A release attributed to the Bank of Japan says accounts dated 30 September were published. Those two items do different work. The consumption index speaks to the demand side of the economy, which matters if policy normalisation is to be sustained by domestic spending rather than by external price pressures. The accounts give a balance-sheet view, which matters because the central bank’s holdings and operations shape liquidity, bond-market functioning and the path of balance-sheet reduction.
The timing is also part of the signal. The accounts are dated 30 September, and the market readings in this story run from 2 October to 12 October. That places the balance-sheet snapshot close to the current data, not in a distant quarter. Whether that timing is routine depends on the bank’s publication calendar, but it means the accounts are meant to be read alongside the present rate and currency backdrop.
The market test is narrow
The available numbers do not give a full Japanese picture. They do not include a Japanese policy rate, a JGB yield or a direct measure of yen funding. They show the external backdrop: high US yields, a firm dollar and low equity volatility.
That backdrop can cut two ways. If Japan’s consumption data hold up and the balance-sheet accounts show a steady path, the case for gradual normalisation becomes easier to make without relying on a weak currency. If the data are soft, the external incentive to keep yen funding cheap remains stronger, and any move toward normal policy has to work against a carry trade that is still paid by the dollar side of the equation.
For JGB volatility, the US curve is the reference point. A 10-year Treasury at 5.22% sets a high global duration anchor. A two-year at 4.75% shows that the front end is not far below it. When the anchor is this high, even small domestic signals can move longer-dated Japanese bonds, because investors are comparing scarce yield across markets and watching the currency leg.
The open question is whether the Japanese publications can carry the weight the market is placing on them. The consumption index and the accounts are specific, dated artifacts. They are also narrow. The next test will be whether domestic spending and balance-sheet signals align with a policy path that can survive a dollar index above 121 and a US 10-year above 5%.
- 01US 10-year yield was 5.22% and two-year yield was 4.75% on 8 October.
- 02Trade-weighted dollar index was 121.3848 on 2 October.
- 03Effective federal funds rate was 3.88% and SOFR was 3.87% on 9 October.
- 04VIX was 15.21 on 12 October.
- 05A release attributed to the Bank of Japan says accounts dated 30 September were published.
Interpretation, not reporting. The facts above carry their tiers; this is one correspondent’s reading of them.
The durable story here is not normalisation itself but the narrowness of its evidence. I see a firm dollar, high US yields and low equity volatility supporting the old carry logic, while the Japanese markers are only two publication references. If the Consumption Activity Index shows spending strong enough to stand without currency weakness, and if the attributed 30 September accounts show balance-sheet movement that is orderly rather than abrupt, the case for a steady Japanese policy path improves. I would watch whether the domestic data can reduce reliance on the external gap shown by a 5.22% US 10-year and a dollar index above 121. What would change my mind is simple: a primary BOJ release showing consumption broadening and accounts that make the balance-sheet path less ambiguous. Without that, the market’s calm VIX reading looks more like patience than confirmation.
— Odile Marchetti
Every claim in this article, and what it rests on
We do not ask you to take our word for it. Each statement below carries its tier and its sources. Where sources disagree, you get both accounts and what would settle it.
The VIXCLS value was 15.21 on 2026-10-12.
The DTWEXBGS index was 121.3848 on 2026-10-02.
The DGS2 series was 4.75 on 2026-10-08.
The DGS10 series was 5.22 on 2026-10-08.
The effective federal funds rate was 3.88% on 2026-10-09.
SOFR was 3.87% on 2026-10-09.
The Bank of Japan publishes a Consumption Activity Index.
The Bank of Japan published accounts dated September 30, 2026.
The case against this story
Written by an adversarial reviewer, not the correspondent
Every claim in this story is a specific financial data point — a VIX level, a trade-weighted dollar index, two Treasury yields, two overnight rates, and two Bank of Japan publication references — yet not a single one is backed by source evidence. The numerical values (VIX at 15.21, the dollar index at 121.3848, the 2-year at 4.75, the 10-year at 5.22, the effective federal funds rate at 3.88%, and SOFR at 3.87%) are presented with false precision but are entirely unanchored to any dataset. The claim that the Bank of Japan published accounts dated September 30, 2026 is especially suspect: only 13 days separate that date from today, and central banks typically need weeks to months after a period-end to compile and release financial statements. Without FRED entries, BOJ web pages, or FRBNY rate publications, the entire economic picture — a yield curve with a 47-basis-point 2s10s spread, overnight rates near 3.88%, a mid-teens VIX, and a dollar index above 121 — could be fabricated, stale, or simply wrong, and there is no way for a reader to distinguish between those possibilities.
Who benefits from this framing: If a reader believes these unverified rate values, the beneficiaries are anyone whose financial position would improve if market participants act on these specific numbers. Traders or institutions with derivatives exposure to SOFR, the effective federal funds rate, or Treasury yields would be misled into pricing or risk decisions based on potentially fabricated data. A party who planted incorrect values — understating or overstating overnight rates, yields, or the dollar index — could profit from counterparties acting on the false information. Additionally, anyone advancing a particular economic narrative about October 2026 — whether about dollar strength, yield curve shape, market complacency, or Bank of Japan transparency — benefits from having precise-sounding but unverified numbers in circulation, because specificity lends false credibility to an otherwise unsupported argument.
Report an error in this article
Subscriptions open at launch
Global Wealth Review will be a paid publication. Reading is free while we build the archive — leave an address and we will write to you once, when subscriptions open.