
BOJ bond update and a steep US curve test rate risk
A fresh balance-sheet signal from Japan and high US long yields are forcing investors to rethink policy risk.
 Odile MarchettiCentral banks, rates and sovereign debt

The Bank of Japan has published data on Japanese government bonds it holds, adding a balance-sheet signal to global rates. US two-year and ten-year yields on 9 October stood well above the effective federal funds rate recorded on 13 October. Figures being circulated point to a 3.6% Social Security increase in 2027 and to economists divided on the Fed's next move.
On 9 October, the two-year US Treasury yield stood at 4.80%. The ten-year yield was higher still at 5.24%. Four days later, the effective federal funds rate was 3.88%.
Those three numbers frame a market that is not at rest. The ten-year yield is 44 basis points above the two-year, and 136 basis points above the effective policy rate. That is a wide gap for a system where the central bank's overnight rate is supposed to anchor the curve.
The Bank of Japan has also published data on Japanese government bonds held by the Bank of Japan. The release is thin as stated, but its relevance is not mysterious. When a central bank shows what it holds, investors get a reminder that the marginal buyer in sovereign debt can change without any new issuance.

The 9 October yields also need to be read against the 13 October funds rate, not as separate markets. The funds rate tells investors where overnight money is trading. The Treasury market tells investors what lenders require before committing money for years. When the two diverge this much, the uncertainty is about the path between them.
The open question is whether the long end is pricing genuine policy tightening or a premium for holding debt that official buyers no longer absorb.
The curve is not a simple forecast
A steep long end is often read as a vote for tighter policy, but it is not only that. The 10-year yield can rise because traders expect higher rates, or because they demand more compensation for holding duration through supply, inflation risk or fiscal uncertainty. The two-year is closer to the policy path, yet even it can carry expectations about where the funds rate may go rather than where it is.
One set of figures being circulated adds a second layer. It shows US Social Security benefits rising by 3.6% in 2027, with retired Americans seeing a $75 increase in monthly Social Security checks. That is a concrete cash-flow change, and it keeps the cost-of-living question in the foreground. It also ties a large public payment to the inflation debate, whether or not the next policy move is up or down.
The same material says US inflation rose ahead of the US midterm elections, but it does not name the measure, the month or the base. That vagueness matters. Without a specific index, the statement cannot be tested against the yield levels, and it cannot settle whether the market is pricing a temporary bump or a broader trend.
The Fed question is not settled by one rate
Economists are said to be divided on whether the Fed will raise rates amid inflation uncertainty before the US midterm elections. The market numbers do not resolve that division. An effective federal funds rate of 3.88% is below the two-year yield by 92 basis points, which could point to expected tightening. But it does not prove that the Fed is already on that path, and it does not show whether the pressure is coming from goods prices, services, fiscal transfers or term premium.
This is where the global piece matters. The Bank of Japan's holdings update sits beside US yield data because both affect who absorbs duration. If one large official holder changes its footprint, private investors may need to hold more of the remaining supply. That can demand a higher yield, even if policy expectations do not move one-for-one.
The Social Security adjustment works through a different channel. It raises a visible nominal income stream for retirees, which can support spending and keep inflation politics loud. For bond investors, the issue is not the payment alone. It is whether such adjustments make the fiscal and policy path less predictable.
What would falsify the worry
The open question is whether the long end is pricing genuine policy tightening or a premium for holding debt that official buyers no longer absorb. The first would show up in a clearer inflation measure and a shift in short-term expectations. The second would appear as a wider gap between long yields and the policy rate, even with no firm evidence that the Fed is ready to move.
For now, the data are specific but incomplete. The yields are hard. The federal funds rate is hard. The inflation signal is not. Until the measure and timeframe are named, the market is trading a curve, not a confirmed inflation regime.
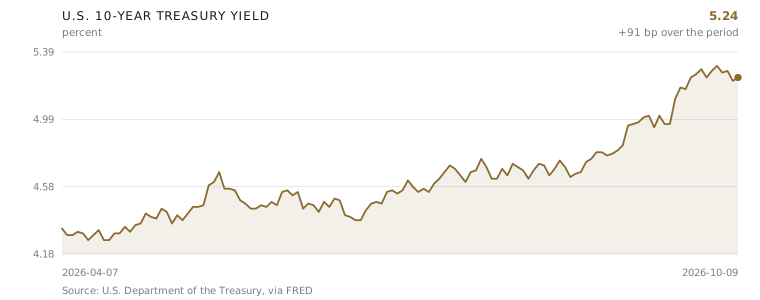
- 01The US two-year Treasury yield was 4.80% on 9 October.
- 02The US ten-year Treasury yield was 5.24% on the same day.
- 03The effective federal funds rate was 3.88% on 13 October.
- 04The Bank of Japan published data on Japanese government bonds it holds.
- 05Figures being circulated show a 3.6% Social Security rise in 2027.
Interpretation, not reporting. The facts above carry their tiers; this is one correspondent’s reading of them.
The market is being asked to price a tightening impulse without a clean inflation print. I do not need the election story to be precise to see the tension: a 10-year yield at 5.24% against an effective funds rate of 3.88% is a wide gap, and the Bank of Japan's holdings update reminds investors that official balance sheets can change the marginal buyer. The 3.6% Social Security adjustment for 2027 matters less as a single payment than as a visible cost-of-living number. I would be more cautious about the tightening interpretation if the inflation measure were named, dated and shown to be temporary. I would also watch whether the gap between long yields and the funds rate narrows without a policy move; that would suggest term or supply pressure rather than a simple rate path. The risk is not one number. It is the missing link between them.
— Odile Marchetti
Every claim in this article, and what it rests on
We do not ask you to take our word for it. Each statement below carries its tier and its sources. Where sources disagree, you get both accounts and what would settle it.
The Bank of Japan published data on Japanese government bonds held by the Bank of Japan.
The US 2-year Treasury yield was 4.80% on 2026-10-09.
The US 10-year Treasury yield was 5.24% on 2026-10-09.
The effective federal funds rate was 3.88% on 2026-10-13.
US Social Security benefits are set to rise by 3.6% in 2027.
Retired Americans will see a $75 increase in monthly Social Security checks.
US inflation rose ahead of the US midterm elections.
Economists are divided on whether the Fed will raise rates amid inflation uncertainty before the US midterm elections.
The case against this story
Written by an adversarial reviewer, not the correspondent
The story's overall picture is internally inconsistent. The verified data points show a 2-year Treasury at 4.80%, a 10-year at 5.24%, and a Fed funds rate at 3.88%. This yield curve clearly signals that markets expect the Fed to raise rates significantly—yet the story claims economists are divided on whether the Fed will raise rates, contradicting the market pricing shown in the same story. Additionally, the claim that inflation rose ahead of the US midterm elections is so vague that no specific measure or timeframe is given, and a Fed funds rate of 3.88% suggests the Fed may have been cutting rates, which typically indicates moderating inflation, not rising inflation. The story uses verified market data to lend credibility to speculative and unverifiable claims.
Who benefits from this framing: Political opponents of the incumbent party benefit from framing inflation as rising before midterm elections. Investors positioned for higher rates—short bond positions, long commodities—benefit from the suggestion that the Fed will raise rates. Media outlets benefit from alarmist economic headlines that drive engagement.
Report an error in this article
Subscriptions open at launch
Global Wealth Review will be a paid publication. Reading is free while we build the archive — leave an address and we will write to you once, when subscriptions open.