
Hot PPI fails to lift Fed hike odds as Treasury curve splits
A PPI print described as much higher than expected sits alongside a split in short and long yields, leaving investors to judge whether haven demand or foreign selling is driving US duration.
 Odile MarchettiCentral banks, rates and sovereign debt

The 10-year US Treasury yield slipped from 5.21% on 13 October to 5.19% on 14 October, while the two-year yield rose from 4.79% to 4.82%. Market participants describe the PPI release as much higher than expected, yet they say odds of a Fed rate hike edged down rather than up. Reports of an AI-driven haven bid in gold and Treasuries sit alongside reported selling by China and Japan.
On 13 October, the long end of the US Treasury curve was elevated, with the 10-year yield at 5.21%. By 14 October, it had slipped to 5.19%, while the two-year yield moved the other way, rising from 4.79% to 4.82%. That split is the story.
The move followed a PPI release that market participants describe as much higher than expected. Yet the same market readings show odds of a Fed rate hike edging down after the print, rather than up.
A hot print, a softer hike bet
Wholesale inflation normally works through the short end first. If producers are charging more, the market asks whether the central bank must keep policy tighter for longer, and that question tends to land in two-year yields.
The two-year yield did rise by three basis points. That is a real move, though not a violent one. But the reported fall in hike odds points the other way. A two-year yield that rises while hike odds slip is not one macro trade; it is two markets arguing.
The level of the two-year also matters. At 4.82%, it remains below the 10-year, leaving the curve positively sloped between those maturities. That shape can coexist with policy caution, but it does not erase the fact that short-dated yields moved higher while long-dated yields moved lower.
A two-year yield that rises while hike odds slip is not one macro trade; it is two markets arguing.
One side may be reacting to the inflation number itself. The other may be treating the same number as a reason to doubt further tightening, perhaps because higher input costs threaten margins or activity. The available figures do not say which interpretation dominated. They only show that the short end was not unanimous.
Haven bids meet foreign selling
The longer end has its own cross-currents. Market participants point to an AI selloff behind the boost in haven assets. Gold is reported to have rallied as haven demand gained, and Treasuries are said to have rallied alongside gold.
A haven rally can lift gold and Treasuries at the same time because both are used as stores of value when risk appetite weakens. But the reported foreign selling introduces a second flow that works through supply rather than sentiment.
A fall in the 10-year yield from 5.21% to 5.19% is consistent with that bid. Lower long yields mean higher long-bond prices, at least for the period covered by these moves.
At the same time, China and Japan are reported to have sold US Treasuries. Selling by large foreign holders usually presses on prices and pushes yields higher, all else equal. That is the mechanical opposite of a haven rally. The description of these flows does not identify an offsetting buyer large enough to absorb the selling while still driving yields lower.
The tape is split, not silent
None of this requires one side of the market to be wrong. Curves can separate when different maturities are answering different questions. The two-year can reflect policy risk. The 10-year can reflect risk aversion, positioning or demand for duration.
But the current picture is thinner than it looks. A hot inflation print, lower hike odds, an AI-driven haven bid and foreign selling are all being used to explain the same two-day move. Without a clearer account of who bought what, the forces do not line up neatly.
For allocators, the practical problem is not the size of either move but the lack of a single price signal. If short rates and long rates are being driven by different hands, a duration position is not one bet on the Fed; it is a bet on which hand dominates.
The open question is whether the long end can keep shrugging off inflation while the short end keeps twitching at it. If the two-year keeps climbing and hike odds still fall, the market is not merely split. It is telling two different stories about the same data.
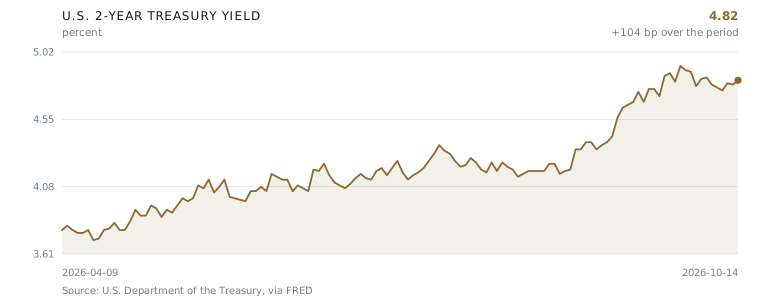
- 01The 10-year US Treasury yield fell from 5.21% to 5.19% between 13 October and 14 October.
- 02The two-year yield rose from 4.79% to 4.82% over the same period.
- 03Market participants describe the PPI reading as much higher than expected.
- 04Reported market odds of a Fed rate hike edged down after the release.
- 05China and Japan are reported to have sold US Treasuries.
Interpretation, not reporting. The facts above carry their tiers; this is one correspondent’s reading of them.
The market is not offering a single macro verdict; it is showing two different balance-sheet behaviours. I can reconcile a hot PPI print with lower hike odds if the short end is questioning whether the Fed will respond to cost pressures, while the long end is being supported by risk aversion. What I cannot reconcile is a haven rally in Treasuries alongside reported selling by China and Japan without knowing who absorbed that supply. The two-year's rise from 4.79% to 4.82% keeps the inflation worry alive. The 10-year's slip from 5.21% to 5.19% keeps the haven story alive. If both persist, the curve is not confused; it is segmented. My test is simple. If the two-year continues higher while hike odds remain soft, the policy signal is weakening. If long yields start rising despite haven flows, the foreign-selling pressure is becoming dominant. Until one of those breaks, I treat the split as a warning about market depth, not a clean directional signal.
— Odile Marchetti
Every claim in this article, and what it rests on
We do not ask you to take our word for it. Each statement below carries its tier and its sources. Where sources disagree, you get both accounts and what would settle it.
US long-term Treasury yields were elevated, with the 10-year yield at 5.21% on 2026-10-13 and 5.19% on 2026-10-14.
Treasury yields were split, with the 2-year yield rising from 4.79% to 4.82% while the 10-year yield fell from 5.21% to 5.19% between 2026-10-13 and 2026-10-14.
The PPI reading was much higher than expected.
Odds of a Fed rate hike edged down after the hot PPI reading.
An AI selloff boosted haven assets.
Gold rallied as haven assets gained.
Treasuries rallied alongside gold as haven assets gained.
China and Japan sold US Treasuries.
The case against this story
Written by an adversarial reviewer, not the correspondent
The story is internally incoherent. It claims a hot PPI reading led to falling rate-hike odds, yet rising 2-year yields (4.79% to 4.82%) signal the opposite — markets pricing in more tightening, not less. It claims Treasuries rallied (yields fell) while simultaneously claiming China and Japan sold Treasuries, which would mechanically push yields higher, not lower; no offsetting buyer is identified. The narrative stitches together contradictory data points — hot inflation with dovish policy expectations, foreign selling with a bond rally — that cannot coexist without additional explanation the story never provides. A reader cannot act on a framework where the same data set points in opposite directions.
Who benefits from this framing: Readers who accept this framing are steered toward a 'buy gold and havens regardless of the data' posture. Gold promoters and haven-asset managers benefit from a narrative that stacks multiple bullish factors — an AI selloff, foreign Treasury selling, a dovish Fed — even when those factors contradict each other. The claim that China and Japan are dumping Treasuries specifically benefits voices pushing a de-dollarization or US-fiscal-collapse thesis, since it implies foreign creditors are fleeing even as the story simultaneously claims Treasuries rallied. Anyone already positioned long gold or short the dollar gains if readers act on this contradictory but fear-tinged narrative.
Report an error in this article
Subscriptions open at launch
Global Wealth Review will be a paid publication. Reading is free while we build the archive — leave an address and we will write to you once, when subscriptions open.