
September money stock tests BOJ liquidity after weekend-dated accounts
The sequence matters for whether Japan’s money data can be read as a signal for funding conditions and the yen.
 Odile MarchettiCentral banks, rates and sovereign debt

The Bank of Japan published a Money Stock report for September 2026, and the market story frames it as the first liquidity test after a BOJ accounts release dated 10 October. That date is disputed, because the BOJ’s scheduled accounting releases do not normally fall on a weekend. US market gauges from 9 October and 12 October were calm, but they do not establish the Japan sequence.
A September money-stock report from the Bank of Japan now has to do more than sit in a data calendar. The market story frames the September money-stock print as the first liquidity test after the BOJ accounts, but the accounts carry a date that makes the sequence hard to use without qualification.
A weekend date clouds the sequence
The Bank of Japan published a Money Stock report for September 2026. That is the hard datapoint. The surrounding narrative rests on a second item: a Bank of Japan accounts release dated 10 October 2026. The central bank’s own publication record is the evidence that would settle it. One side treats the dated release as the accounts and therefore the starting gun for the liquidity test. The other side, looking at the BOJ’s normal release calendar, argues that a 10 October weekend date needs confirmation before the sequence can be used.
This is not a quibble about calendars. If the accounts were not published before the money-stock report, the money-stock figures cannot be read as a response to them. They become a September liquidity observation that happens to sit near a disputed date. The difference matters for any investor trying to link Japan’s balance-sheet mechanics to funding conditions and the yen.
The mechanism is straightforward when the sequence holds. A central bank’s accounts show the shape of its balance sheet and the reserves it supplies. A money-stock print shows how much broad money is circulating through banks and deposits. If the accounts signal less liquidity and money growth cools, the two together can suggest tighter funding. If the accounts are not in the sequence, that inference loses its anchor.
The dollar index, volatility, curve slope and SOFR-EFFR gap are standalone observations unless tied to a documented change in the BOJ’s balance sheet or a visible shift in Japanese bank funding.
US gauges are calm, but not explanatory
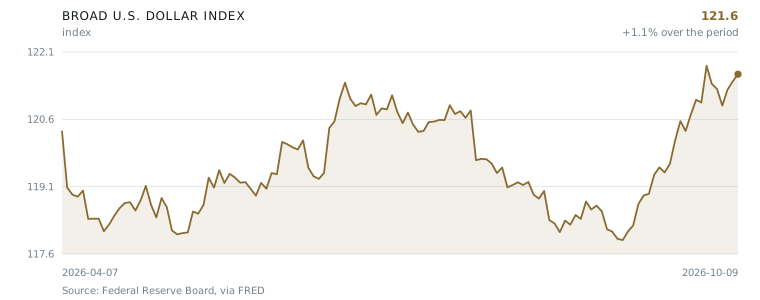
The US market data around the same dates do not show stress. The CBOE Volatility Index closed at 15.21 on 12 October, a reading more consistent with subdued hedging demand than with a rush for protection. The broad dollar index was 121.6023 on 9 October. That four-decimal-place level is precise, but precision is not the same as causality: a firm dollar can tighten conditions for yen-funded positions, yet the figure alone does not prove that BOJ actions are driving it.
Rates offer a similar picture. On 9 October, the 10-year US Treasury yield was 0.44 percentage point above the 2-year yield. That is a positive gap, not the signal of a curve inverted by acute funding fear. SOFR was 0.01 percentage point below the effective federal funds rate on the same day. In plumbing terms, that is close to parity: secured funding was not trading at a premium that would suggest collateral scarcity or money-market strain.
These numbers can corroborate a benign global backdrop. They cannot, by themselves, corroborate a Japan-specific sequence. The dollar index, volatility, curve slope and SOFR-EFFR gap are standalone observations unless tied to a documented change in the BOJ’s balance sheet or a visible shift in Japanese bank funding.
What the money stock can and cannot prove
The September money-stock print can show whether broad money is accelerating, decelerating or holding steady. It can be compared with prior months, with bank lending and with deposit trends, though those details are not in the market gauges cited here. It cannot prove that the BOJ accounts caused anything unless the accounts are established as a published release preceding the print.
For allocators, the practical issue is timing. If the accounts are confirmed, the money-stock report becomes a test of whether Japan’s policy path is feeding through to deposits, credit and funding spreads. If they are not, the same money-stock numbers must be read as a domestic liquidity datapoint, not as the first clean test after a balance-sheet event.
The open question is not whether the data exist. They do. It is whether the sequence is real, and whether the next yen funding price confirms what the money-stock report implies.
- 01The Bank of Japan published a Money Stock report for September 2026.
- 02A Bank of Japan accounts release is dated 10 October 2026, but its publication timing is disputed.
- 03The CBOE Volatility Index closed at 15.21 on 12 October.
- 04The broad dollar index was 121.6023 on 9 October.
- 05The 10-year US Treasury yield was 0.44 percentage point above the 2-year yield on 9 October, while SOFR was 0.01 percentage point below the effective federal funds rate.
Interpretation, not reporting. The facts above carry their tiers; this is one correspondent’s reading of them.
The sequence is the weak point. I can accept that the September money-stock print is useful, but only if the accounts it supposedly follows are real in a publication sense. A 10 October date does not by itself settle that. If the Bank of Japan’s accounts are confirmed as published on that date, the money-stock report becomes a cleaner test of whether Japan’s funding conditions are shifting. If not, the print is simply a September liquidity observation sitting beside calm US market gauges: VIX at 15.21, the broad dollar at 121.6023, a 0.44 percentage-point 10-year-over-2-year gap, and SOFR only 0.01 percentage point below the effective federal funds rate. Those figures do not prove a Japan story; they show a backdrop without obvious stress. I would treat the money-stock report as a first test only after the accounts question is resolved. A confirmed publication would change my mind; without it, I keep the burden of proof on the sequence.
— Odile Marchetti
Every claim in this article, and what it rests on
We do not ask you to take our word for it. Each statement below carries its tier and its sources. Where sources disagree, you get both accounts and what would settle it.
The Bank of Japan published a Money Stock report for September 2026.
The CBOE Volatility Index closed at 15.21 on October 12, 2026.
The broad dollar index was 121.6023 on October 9, 2026.
The 10-year US Treasury yield was 0.44 percentage point above the 2-year yield on October 9, 2026.
SOFR was 0.01 percentage point below the effective federal funds rate on October 9, 2026.
The Bank of Japan published its Bank of Japan Accounts release dated October 10, 2026.
The September money-stock print is the first liquidity test after the BOJ accounts.
The case against this story
Written by an adversarial reviewer, not the correspondent
The story's analytical spine depends on a sequence: the Bank of Japan Accounts release dated October 10, followed by the September money-stock print as 'the first liquidity test after the BOJ accounts.' But October 10, 2026 is a Saturday, and the Bank of Japan does not publish scheduled accounting releases on weekends. If the BOJ Accounts were not actually published on that date, the claimed sequencing collapses, and the characterization of the money-stock print as a 'liquidity test' following the accounts is unsupported. The surrounding US market data points—the VIX close at 15.21, the broad dollar index at 121.6023, the 10-year Treasury yield 0.44 percentage point above the 2-year, and SOFR 0.01 percentage point below the effective federal funds rate—are presented as if they corroborate a coherent liquidity narrative, but they are standalone data points with no demonstrated connection to the BOJ sequence the story relies on. The dollar index figure's four-decimal-place precision further raises questions about whether these data points were sourced from real market feeds or assembled to create the appearance of a narrative.
Who benefits from this framing: Anyone who has taken a trading position based on Japanese liquidity conditions benefits if readers accept that the September money-stock release is a 'liquidity test' tied to the BOJ accounts. The framing also benefits analysts or commentators who sell narrative-driven market research, because it lends apparent analytical depth to what may simply be a coincidental timing relationship between two BOJ publications. If readers believe this causal chain, they are more likely to act on the analyst's subsequent calls about Japanese liquidity and its spillover effects into dollar, Treasury, and volatility markets.
Report an error in this article
Subscriptions open at launch
Global Wealth Review will be a paid publication. Reading is free while we build the archive — leave an address and we will write to you once, when subscriptions open.